- Algo Money
- Posts
- How not to be boring as f*ck
In partnership with
Imagine you’re trying to grow on social media, and you’re launching a product you’d like to ultimately sell. You start cranking out articles left and right. Reams and reams of text for your audience to read.
And you get no results or very little engagement. Why?
One reason might be that you’re boring your audience to tears with information overload. You might have the best product in the world or have critically important stuff to share, but if you package it wrong, people won’t follow you where you want them to go.
And that is deadly for a solo business.
To succeed, you need to be able to capture people’s attention fast and then hold it. And if you want to scale up, you have to have plenty of content to work with to keep people engaged.
Now, consider this: the human brain can process visual cues in as little as 13 milliseconds, and there is reason to believe we can understand information better when it’s presented visually. That’s the psychology behind why video- and photo-based social media platforms are so popular.
This is why memes work. They’re data compression.
If you had the power to transform your complex, written content into visually appealing graphics, how much do you think your engagement might skyrocket? And what if you could crank out visual information as fast as you could write articles?
Well, today we’re diving into a tool that can help you do just that.
Scroll down for a cool visual↓
Stay up-to-date with AI

The Rundown is the most trusted AI newsletter in the world, with 1,000,000+ readers and exclusive interviews with AI leaders like Mark Zuckerberg, Demis Hassibis, Mustafa Suleyman, and more.
Their expert research team spends all day learning what’s new in AI and talking with industry experts, then distills the most important developments into one free email every morning.
Plus, complete the quiz after signing up and they’ll recommend the best AI tools, guides, and courses – tailored to your needs.
Transform Your Content into Visual Gold
GraphicInfo is not just another infographic maker; it's a strategic asset for marketers and content creators looking to simplify complex data into engaging visuals. By inputting a URL, this tool uses AI to summarize content and generate professional infographics that can enhance your marketing material, making it more shareable and digestible.
For Example: Imagine you're launching a new digital course on productivity. Instead of a lengthy blog post, you use GraphicInfo to create an infographic that outlines key lessons and benefits. This not only captures attention on social media but also drives more traffic to your course landing page.
Or let’s say you’re a content marketer whose articles frequently feature complex data or statistics. You could use GraphicInfo to create infographics that visually represent this data, making it more understandable and shareable on social media.
Unique Features: The AI-driven content summary and automatic icon/image selection set GraphicInfo apart, offering a time-saving solution for those without design skills. Highlight features include:
User-friendly interface
Swift creation process
Real-time content search
Customization (text and images)
Check out these examples from InfoGraphic:
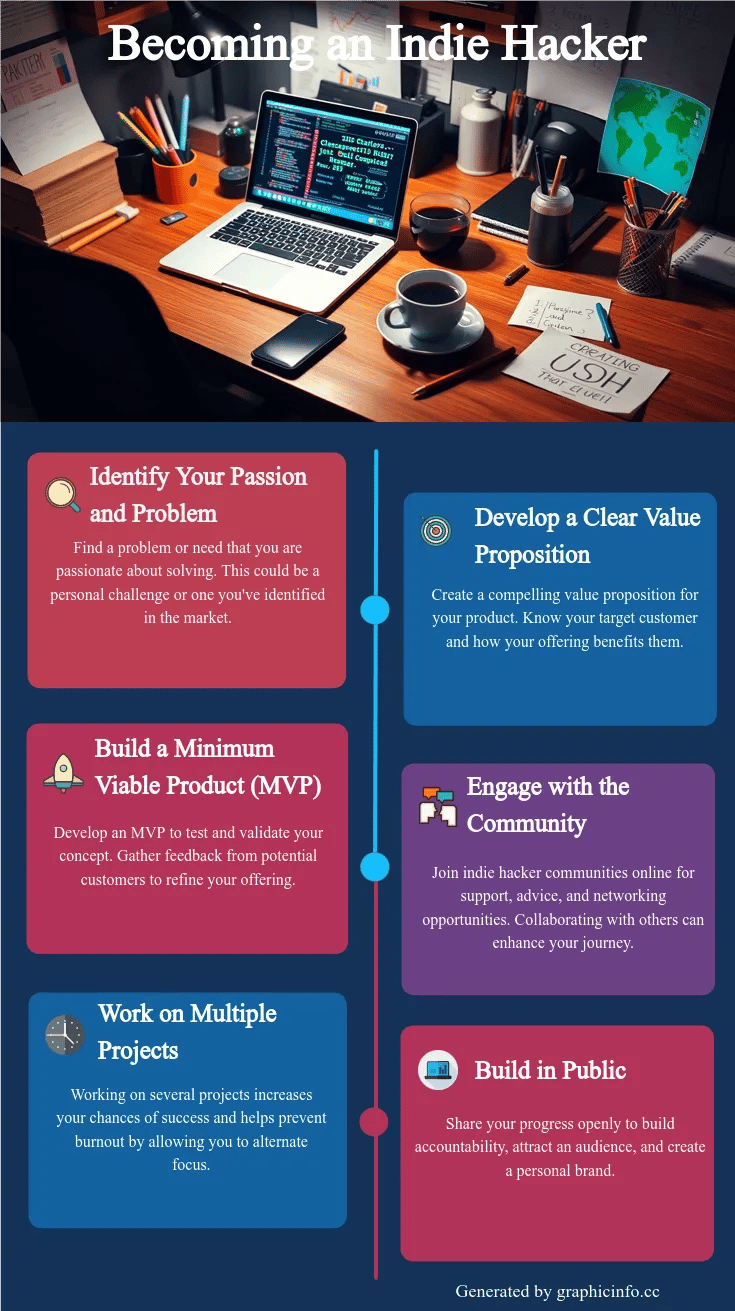
Image: GraphicInfo.cc
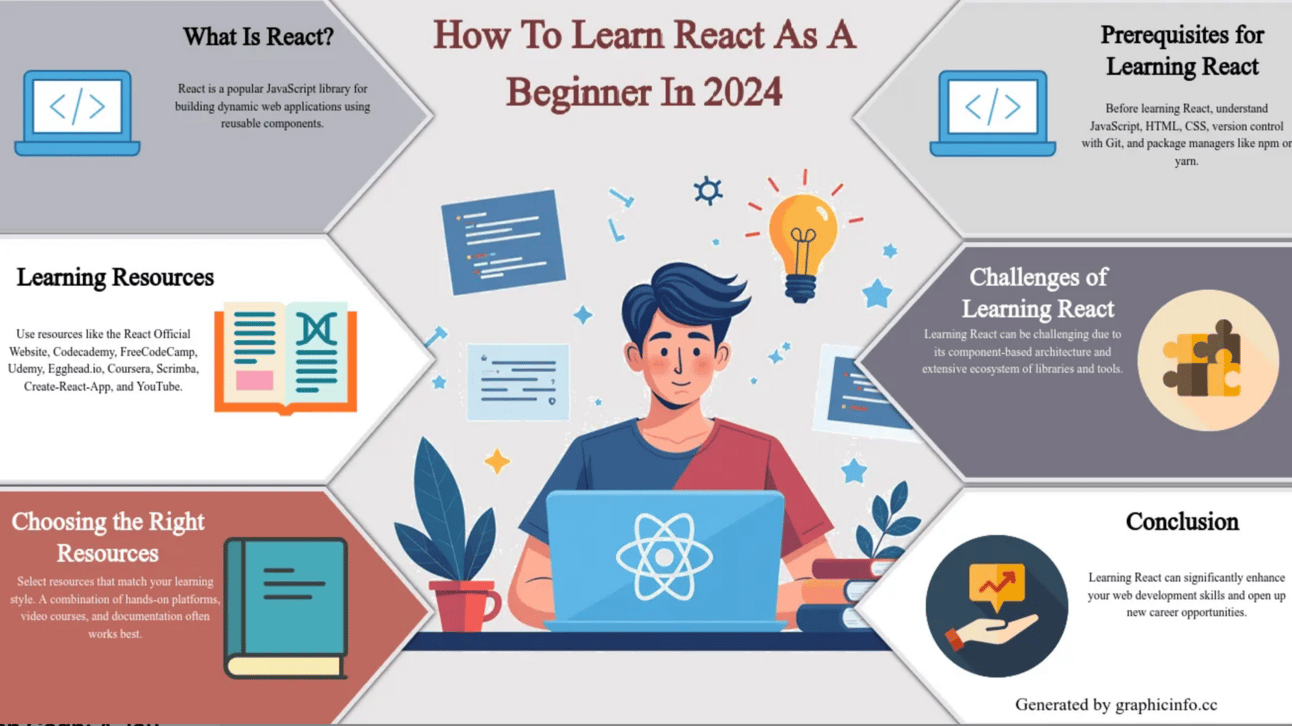
Image: GraphicInfo.cc
Use Cases for Solo Entrepreneurs
Use Cases: GraphicInfo could be particularly beneficial for the following types of solo online businesses:
Niche Content Creators: If you're creating content in a specific niche, GraphicInfo can help convert long-form content into digestible infographics.
Content Marketing Agencies: Solo marketers can use GraphicInfo to quickly create visually appealing infographics that summarize blog posts, reports, or market analyses.
Social Media Marketers: Use GraphicInfo to turn content into eye-catching visuals that stand out in crowded social feeds, potentially increasing likes, shares, and followers.
Creating engaging visual content for X or Instagram might be one of the best use cases for this software. Here are some ideas on how to use it for that purpose:
Infographics on X:
Threads: Create a thread where each tweet features an infographic from a series or parts of a larger topic.
Pinned Tweet: Use an infographic as your pinned tweet to showcase your most compelling content or a value proposition.
Engagement Boost: X users love content that's easy to understand and share; infographics can get retweeted more, expanding your reach organically.
On Instagram:
Posts: Share infographics with engaging captions, leveraging hashtags to reach a broader audience. Use the grid to break down complex information into parts if necessary.
Stories: Post infographics in stories with swipe-up links, or use them to tease content, directing users to your bio link for more.
The Wrap
GraphicInfo could be a great way to create quality content for your business, whether that’s marketing materials, social media content, or newsletters. In fact, don’t be surprised to see a chart or two appear here in Algo Money!
Explore GraphicInfo
Follow Algo Money on X for more insights on leveraging AI for business growth.
If you haven’t checked it out yet, don’t forget your free 25 AI Business Tools Notion Resource